Documentation Index
Fetch the complete documentation index at: https://cubed3-docs-cub-2416-update-semantic-snowflake-semantic-vie.mintlify.app/llms.txt
Use this file to discover all available pages before exploring further.
Filtering
Dimensions and measures can be added as filters to focus on specific rows of data.Pivoting
You can add dimensions to the pivot by right-clicking on the left pane or in the results header. Note that chart tables are different from results tables. You can configure pivots in chart tables separately.Limiting
By default, queries are limited to 5,000 rows of data, but the limit can be adjusted up to 50,000.Sorting
You can sort query results using drop-down menus on column headers in the results table or the dedicated sorting control.Column headers
Hover over a column header in the results table and expand the context menu to sort ascending, sort descending, or clear sorting. If a column has sorting applied, a chevron icon on the header indicates the current sorting direction.Sorting control
The sorting control, available via the Sort button, lists all query members and their current state: unsorted, sorted ascending, or sorted descending. Use it to apply or change the sort order for any member. Drag and drop members within the sorting control to change their priority in the sort order.Inspecting queries
Every query in the Semantic Query tab can be inspected as code. Open the SQL panel via the SQL button in the top-right toolbar to see the query that the workbook generates, switch between representations, and copy it for use elsewhere.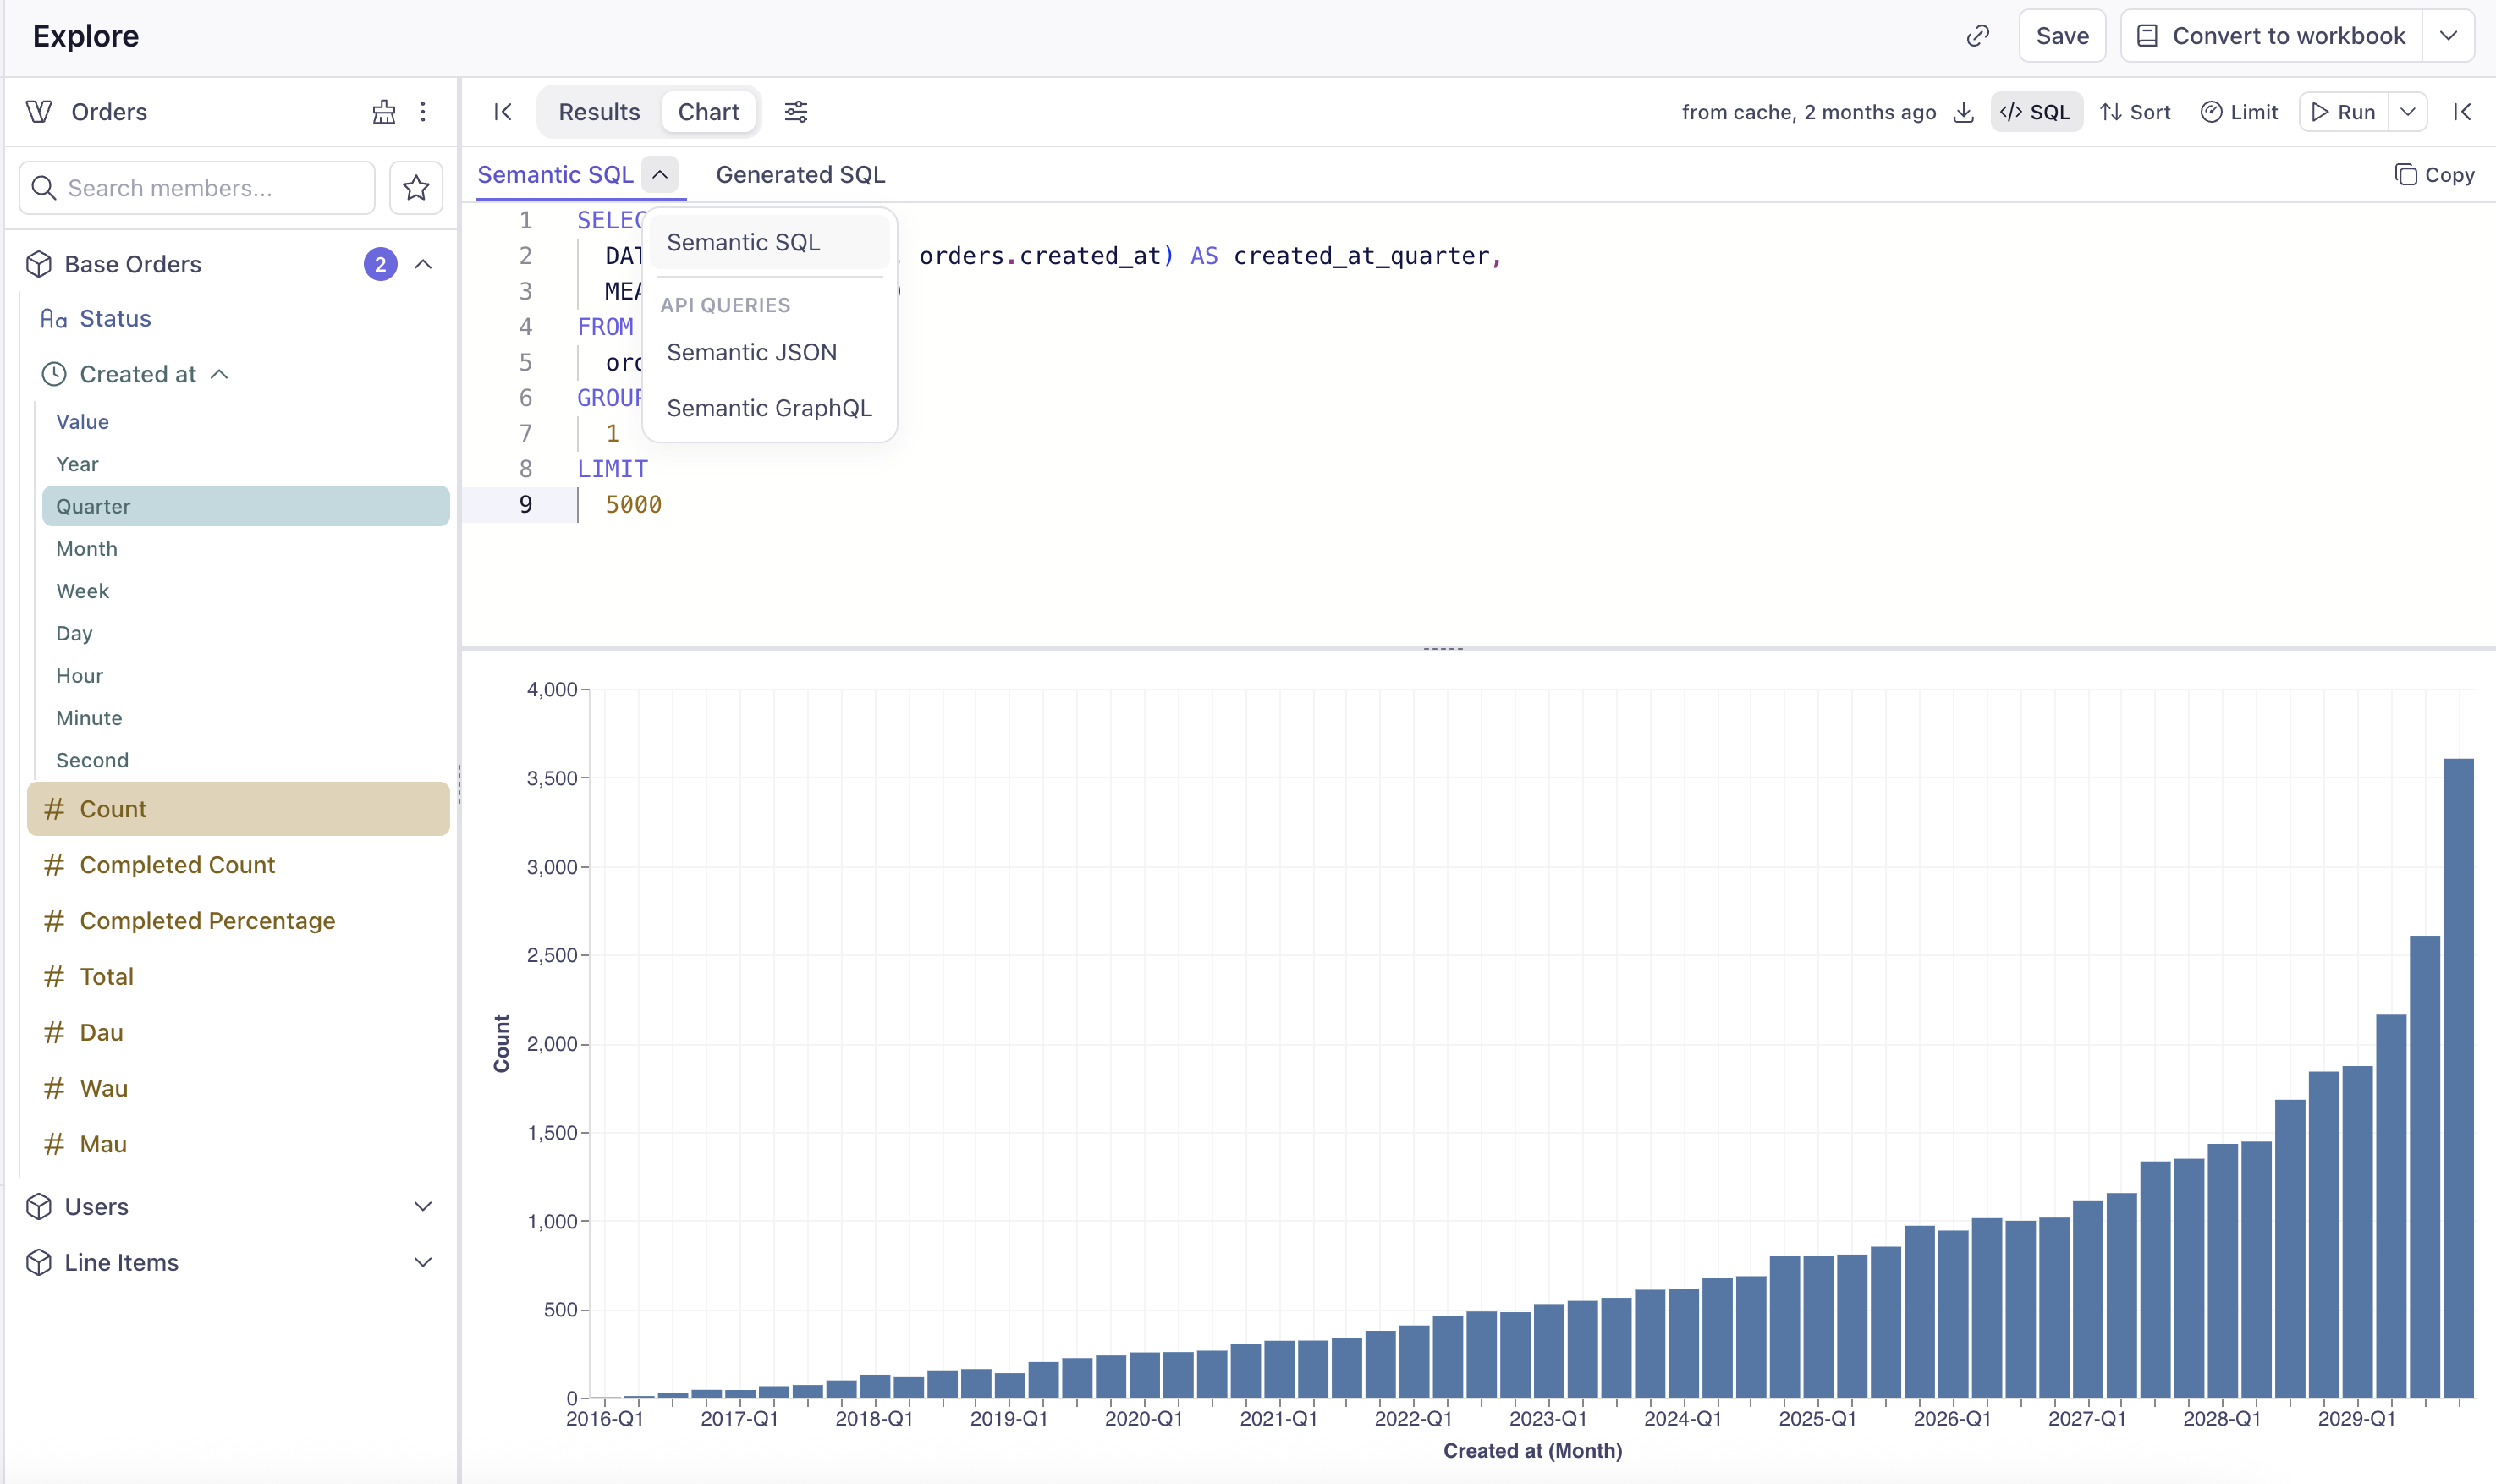
- Semantic SQL — the query expressed against the Semantic Model (semantic views, measures, dimensions, and
MEASURE()calls). This is the source of truth for the query and what the workbook stores. - Generated SQL — the SQL that Cube compiles from the Semantic SQL and sends to your data warehouse. Use it to understand exactly what runs against your database, debug performance, or share with a database administrator.
- Semantic JSON — the REST (JSON) API query format
- Semantic GraphQL — the GraphQL API query format
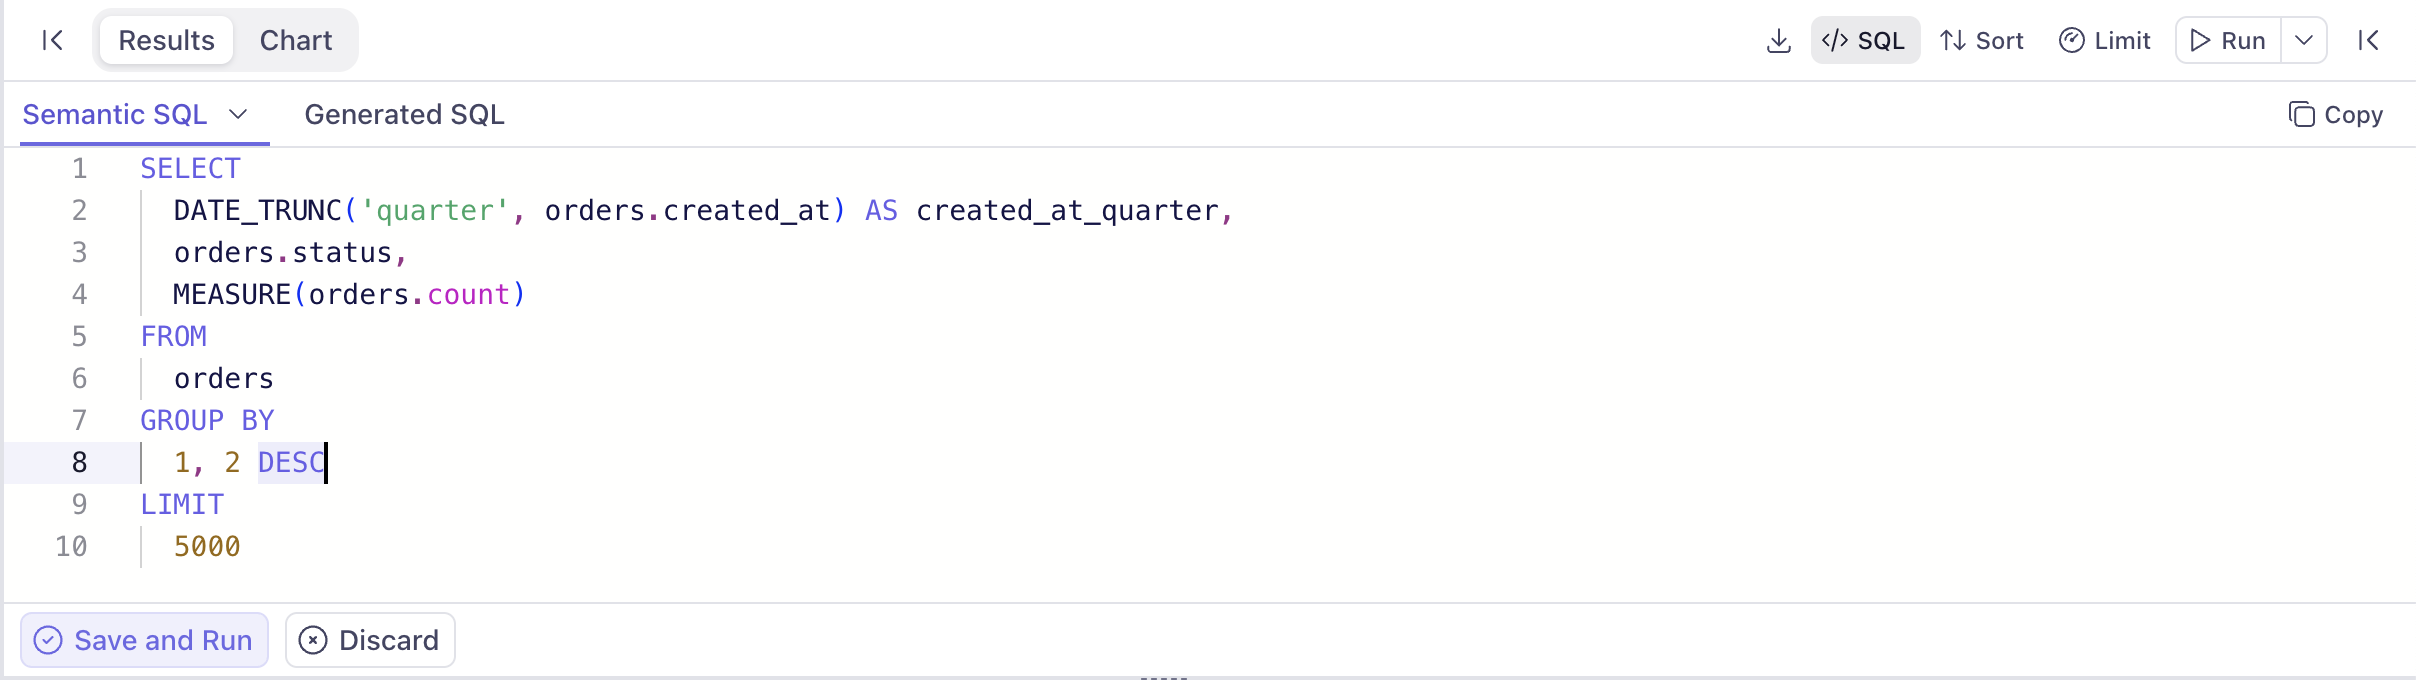
Editing Semantic SQL by hand
You can edit the Semantic SQL directly in the editor to refine a query — for example, to add aWHERE clause, change GROUP BY order, or apply a different sort. After making changes, click Save and Run to apply them to the query and refresh the results, or Discard to revert.
Advanced semantic queries
Advanced semantic queries typically can contain CTEs (Common Table Expressions) and unions, and can contain multiple semantic views. In many cases for advanced semantic queries, the interactive components of the UI would be disabled—not the whole UI—as these complex queries require manual SQL editing.Currently, advanced semantic queries can be placed on dashboards, but dashboard filters cannot be applied to advanced semantic queries.